Series, DataFrames, and labels
Meet pandas’ core data structures and learn why labels and indexes matter.
Two core data structures
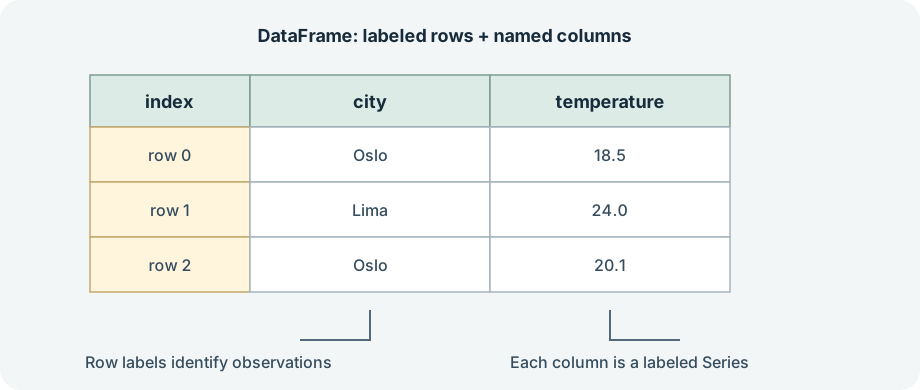
A Series is a one-dimensional labeled array. A DataFrame is a two-dimensional table with labeled rows and columns. DataFrame columns can have different data types, which makes the structure a natural fit for spreadsheet-like records.
import pandas as pd

prices = pd.Series([2.50, 4.00, 3.25], index=["tea", "coffee", "juice"])

inventory = pd.DataFrame(
    {
        "item": ["tea", "coffee", "juice"],
        "price": [2.50, 4.00, 3.25],
        "in_stock": [True, True, False],
    }
)

print(prices["coffee"])  # 4.0
print(inventory.shape)   # (3, 3)
print(inventory.columns.tolist())  # ['item', 'price', 'in_stock']
In the DataFrame, each column is a Series. The row index labels observations; by default pandas creates a RangeIndex of integers, but an index can also contain meaningful labels such as dates or IDs.
Labels affect calculations
Pandas aligns Series by their index labels when combining them. This is helpful when labels describe the data, but can surprise you if you expect values to be combined only by position:
morning = pd.Series([10, 20], index=["Mon", "Tue"])
evening = pd.Series([3, 5], index=["Tue", "Wed"])

print(morning + evening)
# Mon     NaN
# Tue    23.0
# Wed     NaN
Only the matching "Tue" labels have values on both sides. A missing result is not the same as a positional calculation; inspect indexes when the result contains unexpected missing values.
Exercise: Create a Series of three city names indexed by short IDs, and a DataFrame with the same IDs and a numeric measurement. Select one Series value and one DataFrame row.
Sources: pandas: 10 minutes to pandas, NVIDIA: What Is pandas?